
July 7, 2026
The Most Revealing Things to Track Together: A Ranked Guide to High-Signal Pairs
If you only have time for two or three tracking pairs, which ones reveal the most? This is an opinionated ranking of the highest-signal pairs in personal data, with the reasoning behind each pick and a short list of pairs to skip.
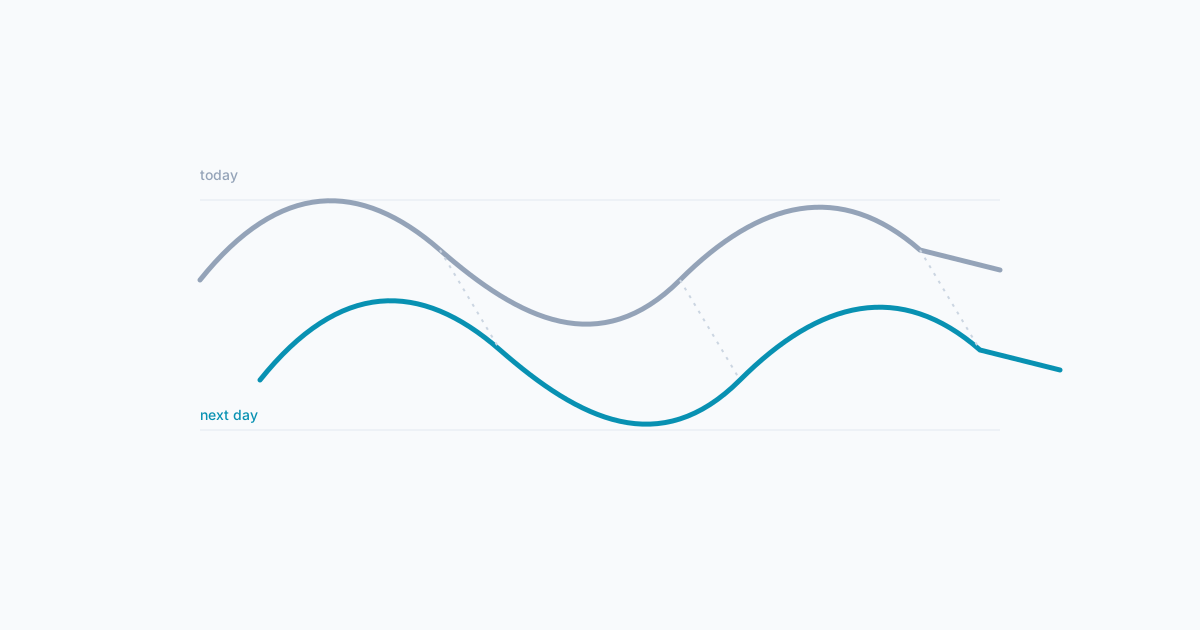
If you could only track three pairs of fields for the rest of your life, which would you pick? Most people, asked cold, name something like “steps and weight.” They are wrong. Steps and weight is a low-signal pair: both fields are noisy daily, and measuring either tends to change it. The pairs that actually pay back the logging effort look quite different.
This is the opinionated ranking. It picks specific pairs, says why each one is worth tracking, and is direct about which popular pairs to skip. It is the practical follow-up to our piece on tracking pairs, not singles, which laid out the design principles. Here we name names.
What makes a high-signal pair
Four properties separate a pair that consistently reveals something from a pair that consistently wastes your time.
Both fields are easy to log honestly in under twenty seconds. If a field is hard to enter, you skip it on busy days, which is exactly when the pair would be most informative. A scale rating you log every evening beats a precise number you log three times a week.
The relationship is plausible but not tautological. “Hours worked and feeling tired” is a pair, but you do not need data to confirm it. Good pairs sit in the middle: there is a story to tell, but the direction or the size of the effect is not already known to you.
The pair has reasonable variance on both sides. If your bedtime is the same every night to within fifteen minutes, the bedtime field cannot pair with anything, because there is no spread to compare against.
At least one field is something you have some influence over. A pair where one input is a choice you can make or skip is the kind that can later inform a decision.
A pair that hits all four tends to pay back the logging effort within four to six weeks. A pair that misses two or more leaves you with rows of data and no story.
The ranking
Eight pairs, in rough order of how often they yield something useful for the average person who logs for a couple of months. Your ranking will not be exactly this. Treat it as a starting point.
1. Sleep and next-day focus
The canonical day-after pair, and the one we covered in detail in our sleep and focus piece. It hits all four criteria cleanly. Sleep is honestly logged in the morning. Focus is honestly rated once a day. Both fields vary. The relationship is plausible but the size and shape are not obvious until you see your own data.
Why it ranks first: it is the pair most likely to show a readable pattern within a month, and the pattern, when it shows, almost always changes how someone thinks about their evenings. A 1-to-2-point focus gap between high-sleep and low-sleep nights tends to reframe sleep as an input worth investing in, not a recovery activity that happens after the day is done.
Set it up: sleep hours (number) or sleep quality (scale 1 to 10), focus (scale 1 to 10) logged at a consistent time.
2. Mood and exercise
The pair most-asked about, and the one whose direction is most often surprising. People expect “exercise lifts mood” to show up cleanly. What shows up is more interesting and more individual.
Some people see a same-day lift: workout in the morning, higher mood that evening. Others see a day-after lift: workout on Tuesday, higher mood on Wednesday. A minority see no relationship, or a small inverse for the most intense sessions, because the energy cost overshadows the mood lift for them. All three findings are real.
Why it ranks high: the shape of the relationship matters more than its existence. If exercise lifts your mood the same day, that is information you can use; if it lifts it the next day, that is also information you can use, in a different way.
Set it up: mood (scale 1 to 10), exercise (yes or no, or a categorical: rest, light, moderate, hard).
3. Energy and caffeine
The pair with the fastest feedback loop, and the one where people most often overestimate their tolerance.
Track caffeine (cups, or a yes-or-no for “any after a chosen time”) and energy (scale 1 to 10). Two weeks is often enough to see something. The relationship people commonly assume is “more caffeine, more energy.” What often shows up is closer to “more caffeine, similar energy, slightly worse sleep, and a noticeable next-day energy dip.”
That second pattern only emerges when you log both fields honestly, including the cups you would rather not count. The pair is unforgiving of dishonest logging, which is also part of what makes it useful.
Set it up: caffeine (number, in cups), energy (scale 1 to 10), and ideally sleep hours or quality alongside, since the interesting effect often shows through sleep.
4. Mood and weather
The pair people most often expect to be strong, and the one whose actual strength varies most by individual. A meaningful minority show a clear weather link in their mood data. Many show almost none. The interesting bit is where you personally fall on the spectrum. Some people are weather-resilient in a way they did not know. Others are weather-sensitive in a way they had been blaming on other things.
Weather is the cleanest example of a pair where the input is not under your control. You cannot change the weather, but you can change what you do on the kinds of days that tend to drag your mood.
Set it up: mood (scale 1 to 10), weather (categorical: sunny, cloudy, rainy, mixed) or a simpler “sunny: yes or no.”
5. Focus and previous-evening screen time
A newer pair, increasingly relevant as evening phone use has crept upward. It is a day-after pair: the cause sits on day N, the effect sits on day N+1.
Log how many minutes you spent on a screen after a chosen cutoff (22:00 or 23:00) and rate focus the next day. The same-day version is often weak, because evening screens shape sleep, and sleep shapes next-day focus. The day-after version catches the chain in one comparison.
The pair is unforgiving in a useful way. People who claim “phone before bed does not affect me” tend to discover, with two months of data, that it does, often by a 1-to-1.5 point next-day focus gap.
Set it up: late-night screen time (number, in minutes after a cutoff), focus (scale 1 to 10, logged consistently the next day).
6. Mood and social plans
The introvert and extrovert reveal. The pair tells you what kind of social rhythm your data actually thrives in, regardless of what you say you prefer.
Some people log a clear lift on days with social plans and a small dip on isolated days. Others log the opposite. A third group shows no relationship, which is also a finding. With two months of data, one of the three usually wins clearly.
The result is often genuinely surprising. People who identify as extroverts sometimes see a quiet-day lift, and vice versa. The pair is less about labelling yourself and more about noticing what your data shows.
Set it up: mood (scale 1 to 10), social plans (yes or no, or a categorical: solo, small group, large group, busy social day).
7. Sleep and alcohol
A chained day-after pair, and the one whose data is most often unforgiving.
Track alcohol (yes or no in the evening, or number of drinks) and sleep the following morning (hours, quality, or both). Most people who log this pair honestly for six weeks see a clear pattern, and the size is usually larger than expected: a quality rating one to two points lower, sleep hours shorter by half an hour or so, and sometimes a secondary effect on the next-next-day focus.
Why it is not higher: the pair is uncomfortable for people whose evenings include alcohol regularly. The data is honest in a way that often pre-decides the question. If you want to see this pattern, log it. If you log it, you will probably see it.
Set it up: alcohol (yes or no in the evening, or a small number for drinks), sleep quality (scale 1 to 10) and sleep hours (number).
8. Energy and time outside
The cheapest pair to influence, and the one most often underweighted in self-tracking setups.
Time outside is a quirky input: cheap, plausible, somewhat under your control, and it varies more day-to-day than people notice. Pair it with energy (or mood, or focus) and a meaningful share of people see a small but consistent same-day or next-day lift on the days they got more than thirty minutes out.
Why it ranks here and not higher: the lift, when it shows, is usually modest. A 0.5 to 1 point gap on a 1 to 10 scale is typical. That is real but easy to miss against louder inputs like sleep or caffeine. The pair earns its slot because the cost of acting on it (a short walk during lunch) is so low that even a small effect is worth knowing.
Set it up: time outside (number, in minutes), energy or mood (scale 1 to 10).
The anti-recommendations
Some pairs look interesting but rarely yield readable signal. Tracking them is not a mistake, but the time is usually better spent elsewhere.
Step count and mood
Steps are noisy on a daily timescale and respond more to your calendar (commuting day, errands day, desk day) than to anything about you. The pair often shows a weak same-day relationship that is really about both fields being downstream of “what kind of day it was.” If your watch logs steps automatically, by all means look at the pair. But do not set up step counting for the purpose of pairing it with mood.
Calorie tracking and anything
The problem is not that calories cannot relate to other fields. It is that the act of calorie tracking changes behaviour, often substantially, in a way that contaminates the pair. Once you start counting calories, your eating shifts. The data you collect describes calorie-tracking-you, not your normal self. If you want to look at food and mood, a categorical field (light, normal, heavy) or a “felt heavy after lunch: yes or no” is a less contaminating choice.
Step count and weight
Worth naming because many trackers default to it. Both fields are noisy daily (steps move with your schedule, weight moves with hydration and the previous day’s food). The signal, if there is one, is slow enough to need months of data to read. Higher-yield pairs exist for the same logging effort.
How Loggr handles these pairs
For any pair on this list, you do not have to choose whether to look at it same-day or next-day. Loggr compares every pair you log both on the same date and with a one-day shift, then keeps whichever relationship is stronger.
Sleep and focus shows up as the day-after version automatically. Caffeine and energy shows up as same-day for some people, next-day for others. Alcohol and sleep shows up as day-after by default. You do not configure any of this. You log the fields. Loggr does the comparison.
Build a stable core, then add experiments
Split your setup into two parts.
Your stable core is the two or three pairs you track indefinitely, because they are the relationships you most want to understand over the long run. For most people that is: sleep and focus, mood and one input (exercise or social plans or time outside), and one more pair that matters to your situation.
Your experimental layer is one or two pairs you add for a specific question over a defined window. “I want to know whether caffeine after 2pm is affecting my sleep, so I will log caffeine timing and sleep quality for eight weeks.” After eight weeks, you have an answer, and you can drop the field if it no longer earns its slot.
The split keeps daily logging short while letting you investigate things as they come up.
FAQ
Should I track all eight pairs at once?
No. Two to three stable pairs plus one experimental pair is the upper end for most people. Tracking eight pairs means tracking five or six fields, which is enough that the logging becomes a chore, the chore becomes a missed day, and the missed day breaks the comparison.
What if my data shows no connection for a pair I expected to be strong?
That is also a finding. It usually means one of three things. The pair is genuinely weak for you. Or one of the fields has too little variation (your bedtime is always the same, your mood is always a 6 or 7). Or you have not logged long enough yet. Try four to six more weeks. If still flat, drop it.
Can I track the same field in multiple pairs at the same time?
Yes, and you should. Sleep can be paired with focus, mood, and energy simultaneously without any extra logging. You log sleep once a day, and Loggr compares it against every other field you log. The pair design is in your head; the comparison happens automatically.
Key takeaways
- Not all pairs are equal. A high-signal pair has four properties: both fields are easy to log honestly, the relationship is plausible but not obvious, both fields vary, and at least one is something you can influence.
- The eight ranked pairs, in order: sleep and focus, mood and exercise, energy and caffeine, mood and weather, focus and previous-evening screen time, mood and social plans, sleep and alcohol, energy and time outside.
- Pairs worth skipping: step count and mood, calorie tracking and anything, step count and weight.
- Loggr compares every pair both same-day and with a one-day shift automatically. You do not choose; the comparison picks itself.
- Split your setup into a stable core (two to three pairs tracked indefinitely) and an experimental layer (one pair tracked for a specific question over a defined window).
- A flat result for a pair is also a finding. It usually means the pair is genuinely weak for you, not that the tracking failed.
Pick two pairs and start
If you do nothing else after this article, pick two pairs from the ranked list and log them honestly for two weeks. The cheapest place to start is sleep paired with focus, and one of mood paired with exercise or mood paired with social plans. Three to four fields, ten to fifteen seconds a day.
You can open Loggr and set them up in under a minute. Six field types, on iOS, Android, and web, same data everywhere. After two weeks you will have a first sketch. After a month or two you will know which pairs are loud for you and which are quiet, and be able to add a third on evidence rather than guesswork.